


The question is not ‘what happens if we suffer a breach?’ But ‘what happens when we suffer a breach?’.
In a world where cyber incidents are inevitable, it is best to do everything possible to ensure your organization is prepared for when things do go wrong. Step one is ensuring that logging is set up properly and that you are collecting the right data. Otherwise you might find yourself in a situation where you need to perform an investigation, but find that you don’t have the right visibility.
All security best practices dictate that logging must be enabled for all services in scope. However, these best practices and requirements often leave a lot open to interpretation, and many questions remain unanswered. For example, is it enough to just enable CloudTrail? What logging is turned on default? What logging is absolutely necessary to an investigation? And how are these different logging capabilities enabled?
This blog aims to demystify AWS’ sometimes complicated logging methods to help organizations prepare for when a security incident occurs. Below we’ve outlined which logs should be enabled for the purpose of incident investigations.
AWS CloudTrail
This is by far the most important logging service in AWS. CloudTrail monitors and logs the API activity of almost every single AWS Product.
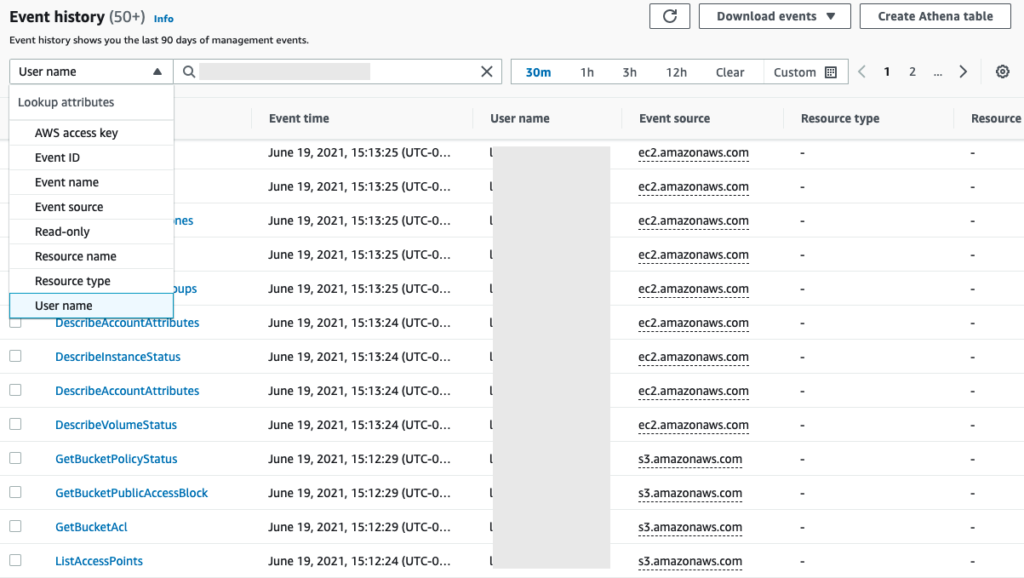
CloudTrail Event History
What does it log?
CloudTrail records API activity such as the user agent, IP address, IAM user or role ARN, as well as any service-specific details about the request
Where does it log to?
CloudTrail is enabled by default and will preserve the past 90 days of activity. However, as best practice it should be configured to also send Logs to an S3 bucket for longer term storage. There is also the option to send logs to CloudWatch.
How do I enable it?
CloudTrail logs are enabled by default. To enable the ability to send ogs to an S3 bucket for longer term storage:
- First create an S3 bucket
- Then go to the AWS Management Console, and select the CloudTrail service.
- From the cloud trail dashboard go to CloudTrail Insights > Create a trail, give the trail a name and configure its attributes; for storage select the S3 you created earlier.
- Finally choose your log events, management events and data events. Review and create your trail.
How do I access the logs?
Logs can be accessed and downloaded via the cloud trail console: https://console.aws.amazon.com/cloudtrail/home/.To view recent events, go to Event History.
The following AWS managed policies are available for CloudTrail:
AWSCloudTrail_FullAccess – This policy provides full access to CloudTrail actions on all CloudTrail resources. This policy provides the required permissions to create, update, and delete CloudTrail trails, event data stores, and channels as well as permissions to manage the Amazon S3 bucket. It doesn’t provide permissions to delete the Amazon S3 bucket, the log group for CloudWatch Logs, or an Amazon SNS topic. Users with this role can turn off or reconfigure important auditing functions in their AWS accounts so use of this policy should be closely controlled and monitored.
AWSCloudTrail_ReadOnlyAccess – This policy grants permissions to view the CloudTrail console, including recent events and event history. This policy also allows you to view existing trails, event data stores, and channels.
EC2
EC2 is AWS’ Elastic compute offering, it supports systems level logging, allowing logs directly from the OS on the instance to be collected via the CloudWatch agent and stored in CloudWatch.
What does it Log?
EC2 collects different system level logs depending on the operating system of the Instance. Below we have listed the default logs that the CloudWatch agent in an EC2 instance collects:
For Amazon Linux / Red Hat Linux / Centos Linux / Ubuntu / SUSE Linux:
/var/log/amazon/ssm/amazon-ssm-agent.log
/var/log/amazon/ssm/errors.log
/var/log/audit/audit.log
/var/log/cloud-init-output.log
/var/log/cfn-init.log
/var/log/cfn-init-cmd.log
/var/log/cloud-init.log (Amazon Linux 1 / Amazon Linux 2 only)
/var/log/cron
/var/log/maillog
/var/log/messages
/var/log/secure
/var/log/spooler
/var/log/yum.log
/var/log/aws/ams/bootstrap.log
/var/log/aws/ams/build.log
/var/log/syslog
/var/log/dpkg.log
/var/log/auth.log
/var/log/zypper.log
Windows
For Windows:
SecurityEventLog
SystemEventLog
AmazonSSMAgentLog
MicrosoftWindowsAppLockerMSIAndScriptEventLog
MicrosoftWindowsAppLockerEXEAndDLLEventLog
AmazonCloudWatchAgentLog
EC2ConfigServiceEventLog (Windows Server 2012 R2 Only)
ApplicationEventLog
AmazonCloudFormationLog
MicrosoftWindowsGroupPolicyOperationalEventLog
AmazonSSMErrorLog
Where does it log to?
Logs from EC2 instances are sent to CloudWatch, and stored in a CloudWatch Log group with the same name as the instance.
The Cado platform can also collect all logs from an EC2, by simply analyzing a snapshot of the system.
How do I enable it?
To enable the logging, the CloudWatch agent must be installed. AWS provides a guide on this here.
How do I access the logs?
Logs can be accessed via CloudWatch
Amazon VPC
Amazon VPC (Virtual Private Cloud) provides AWS customers a logically isolated section of Amazon Web Services Cloud. Allowing them to access the Amazon Elastic Compute Cloud over an IPsec based virtual private network.
What does it log?
Amazon VPC records Network Flow Logs from across the Virtual Private Cloud. Flow log data for a monitored network interface is recorded as flow log records, which are log events consisting of fields that describe the traffic flow.
Where does it log to?
Amazon VPC can send logs to CloudWatch, S3 storage buckets and/or Kinesis firehose.
How do I enable it?
VPC Flow logs are not enabled by default. To create a flow log, you must specify the resource for which to create the flow log, the type of traffic to capture and the destinations to which you want to publish the flow log data. AWS provides three guides on setting up VPC flow logs for S3, CloudWatch and FireHose.
How do I access the logs?
To view flow logs, take o one of the following steps:
- Open the Amazon EC2 console. In the navigation pane, choose Network Interfaces. Select the checkbox for the network interface.
- Open the Amazon VPC console. In the navigation pane, choose Your VPCs. Select the checkbox for the VPC.
- Open the Amazon VPC console. In the navigation pane, choose Subnets. Select the checkbox for the subnet.
Then choose Flow Logs.
Lambda
AWS Lambda is a compute service that lets you run code without provisioning or managing servers. It supports Logging of application logs from the running code.
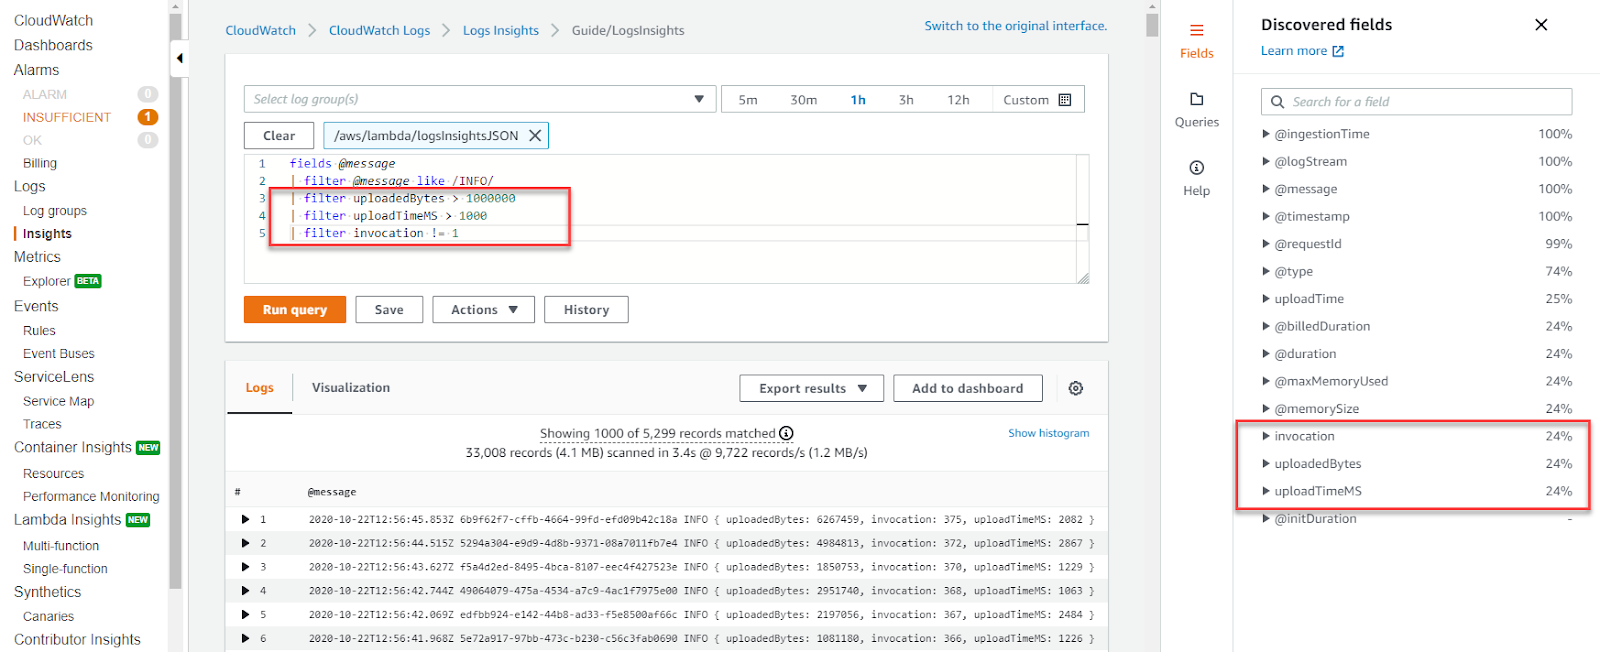
Lambda Logs Viewed in CloudWatch
What does it log?
Lambda logs any application logs sent to stdout/stderr from your running code.
Where does it log to?
Logs are sent to CloudWatch.
How do I enable it?
They are enabled by default, however you must ensure that your function has permission to create log groups and/or streams
How do I access the logs?
Logs can be accessed via the CloudWatch console:
- Open the Functions page of the Lambda console.
- Choose a function.
- Choose Monitor.
- Choose View Logs in CloudWatch.
CloudFront
CloudFront is AWS’ content delivery network. CloudFront has the option to log to an S3 bucket. But also supports real-time logging if needed via a Firehose stream.
What does it log?
CloudFront logs detailed information about every user request that CloudFront receives.
Where does it log to?
Logs are stored in an S3 bucket, or for real-time logs in the Kinesis Firehose data stream.
How do I enable it?
CloudFront logs are not enabled by default. To enable CloudFront access logs:
- Access the CloudFront console.
- Choose the distribution you want to update.
- On the General tab, under Settings, choose Edit.
- For Standard logging, select On.
- Choose the S3 bucket where you want CloudFront to deliver the log files. You can specify an optional prefix for the file names.
- Choose Save changes.
To enable real-time logs:
- Access the CloudFront console.
- From the left-hand navigation, select Logs.
- Choose the Real-time configurations tab.
- Choose Create configuration.
- For Sampling rate, enter the percentage of requests for which you want to receive real-time log records.
- For Fields, choose the specific fields that you want to receive in the log records. In the Choose options dropdown list, select any fields that you want to include in the configuration.
- Choose one or more Kinesis data streams to receive real-time logs.
Note: CloudFront real-time logs are delivered to the data stream of your choice in Amazon Kinesis Data Streams. To read and analyze your real-time logs, you can build your own Kinesis data stream consumer. Or, use Amazon Kinesis Data Firehose to send the log data to Amazon S3, Amazon Redshift, Amazon OpenSearch Service, or a third-party log processing service. - For IAM role, choose Create new service role for the console to create an IAM role for you. To use this option, you must have permission to create IAM roles.
-or-
Use an existing IAM role. - (Optional) In the Distribution section, choose a CloudFront distribution and cache behavior to attach to the real-time log configuration.
- Choose Create configuration.
How do I access the logs?
The standard logs can be downloaded from the S3 bucket. Accessing the real time logs is dependent on the endpoint of your Amazon Kinesis Data Streams.
RDS
Amazon RDS (Relational Database Service) has supported its own intel instance level logging for some time now, but it also has the additional capability to have those logs fed into CloudWatch.
What does it log?
RDS instance level-logs record general, error, audit, and slow query database events.
Where does it log to?
RDS logs are stored internal to the RDS service but it can be optionally configured to send the logs to CloudWatch.
How do I enable it?
RDS logs are enabled by default, but the CloudWatch integration needs to be manually configured. To do this:
- Open the Amazon RDS console at https://console.aws.amazon.com/rds/.
- Go to Databases, and choose the DB instance that you want to modify.
- In the Log exports section, choose the logs that you want to start publishing to CloudWatch Logs.
- Choose Continue, and then choose Modify DB Instance on the summary page.
How do I access the logs?
The Internal RDS service logs are accessible via the RDS console or API. If the CloudWatch integration is enabled, then logs can also be viewed in the CloudWatch dashboard.
CloudWatch
Almost all AWS services support sending logs to CloudWatch. CloudWatchmonitors your AWS resources and the applications that you run on AWS in real time. You can collect and track metrics, create customized dashboards, and set alarms. Making it both a repository and a source for logs from across AWS. With CloudWatch, you have the option to either manually export the logs to S3 storage or stream them directly to other places via other AWS services.
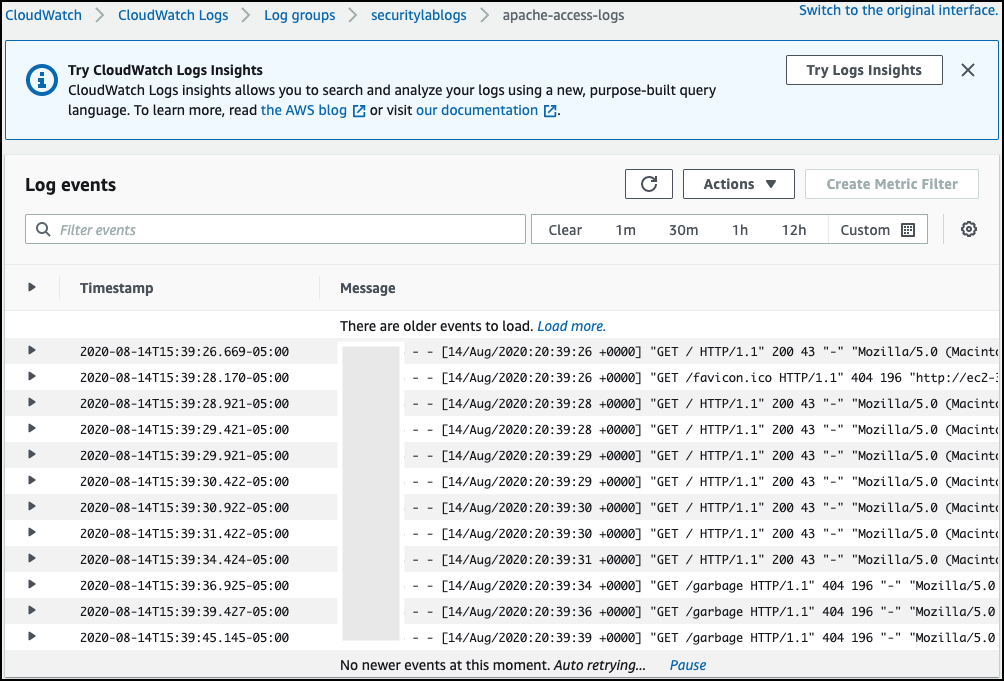
Logs Viewed in CloudWatch
What does it log?
CloudWatch will log whatever logs other services are configured to send to it.
Where does it log to?
CloudWatch can send logs to many different places, Manually there is the option to send the logs to an S3 bucket. If a subscription is configured, then there is the option to send the logs to Lambda, Kinesis Data Stream, or Kinesis Data Firehose Stream.
How do I enable it?
These logs are not enabled by default, all options either manual or subscription must be configured.
The method of configuring Logs to be sent to CloudWatch is dependent on the service you are looking to send logs from. A full list of services that support sending logs to CloudWatch can be found here, along with documentation on configuring them.
How do I access the logs?
To manually export logs to an S3 bucket, AWS provides this guide. To configure real time access via subscriptions, AWS provides this guide.
Being IR Prepared in AWS with Cado
Cado’s Incident Readiness Dashboard empowers organizations to proactively assess their level of preparedness when it comes to investigating and responding to cloud-based incidents. The Incident Readiness Dashboard provides security teams with the ability to proactively run readiness checks, see readiness trends over time, and identify issues that could prevent the organization from rapidly responding to active threats.
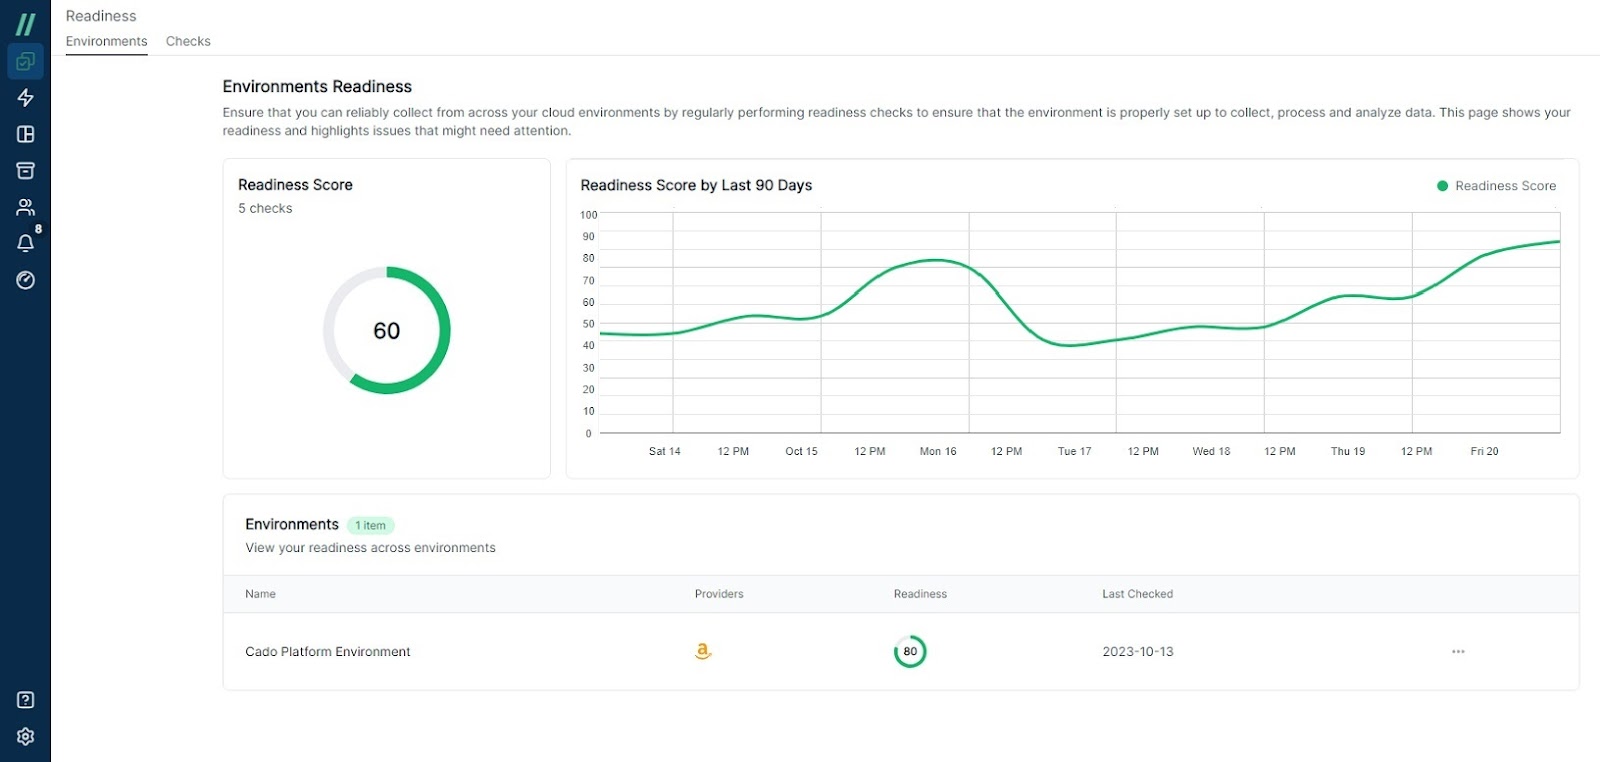
Cado’s Incident Readiness Dashboard
Cado’s Incident Readiness Dashboard delivers the following features:
- The ability to ensure that your organization has the correct logging, management agents, and other cloud-native tools appropriately configured and operational.
- The ability to ensure that data gathered during an investigation can be decrypted.
- The ability to verify that you have the right permissions to acquire and process incident evidence.
To see how Cado can help your organization understand its level of preparedness to investigate and respond to incidents in the cloud, contact our team to schedule a demo.

