


When it comes to incident response, being proactive is key to appropriately managing risk. In the cloud, where there are countless log sources that are critical to an investigation, it is especially important to ensure that your security team is prepared (as many of which are not turned on by default).
While incident response best practices consistently mention cloud-provider logs as a key source of information, it can be difficult to understand which logs are available, which are enabled by default, and where everything is stored.
This blog takes a closer look at GCP’s logging methods, covering the different types of logging, how logs are stored, and how to best access them.
Logs In GCP
GCP is rather different from AWS and Azure in that everything is logged and viewed through one service, Cloud Logging.
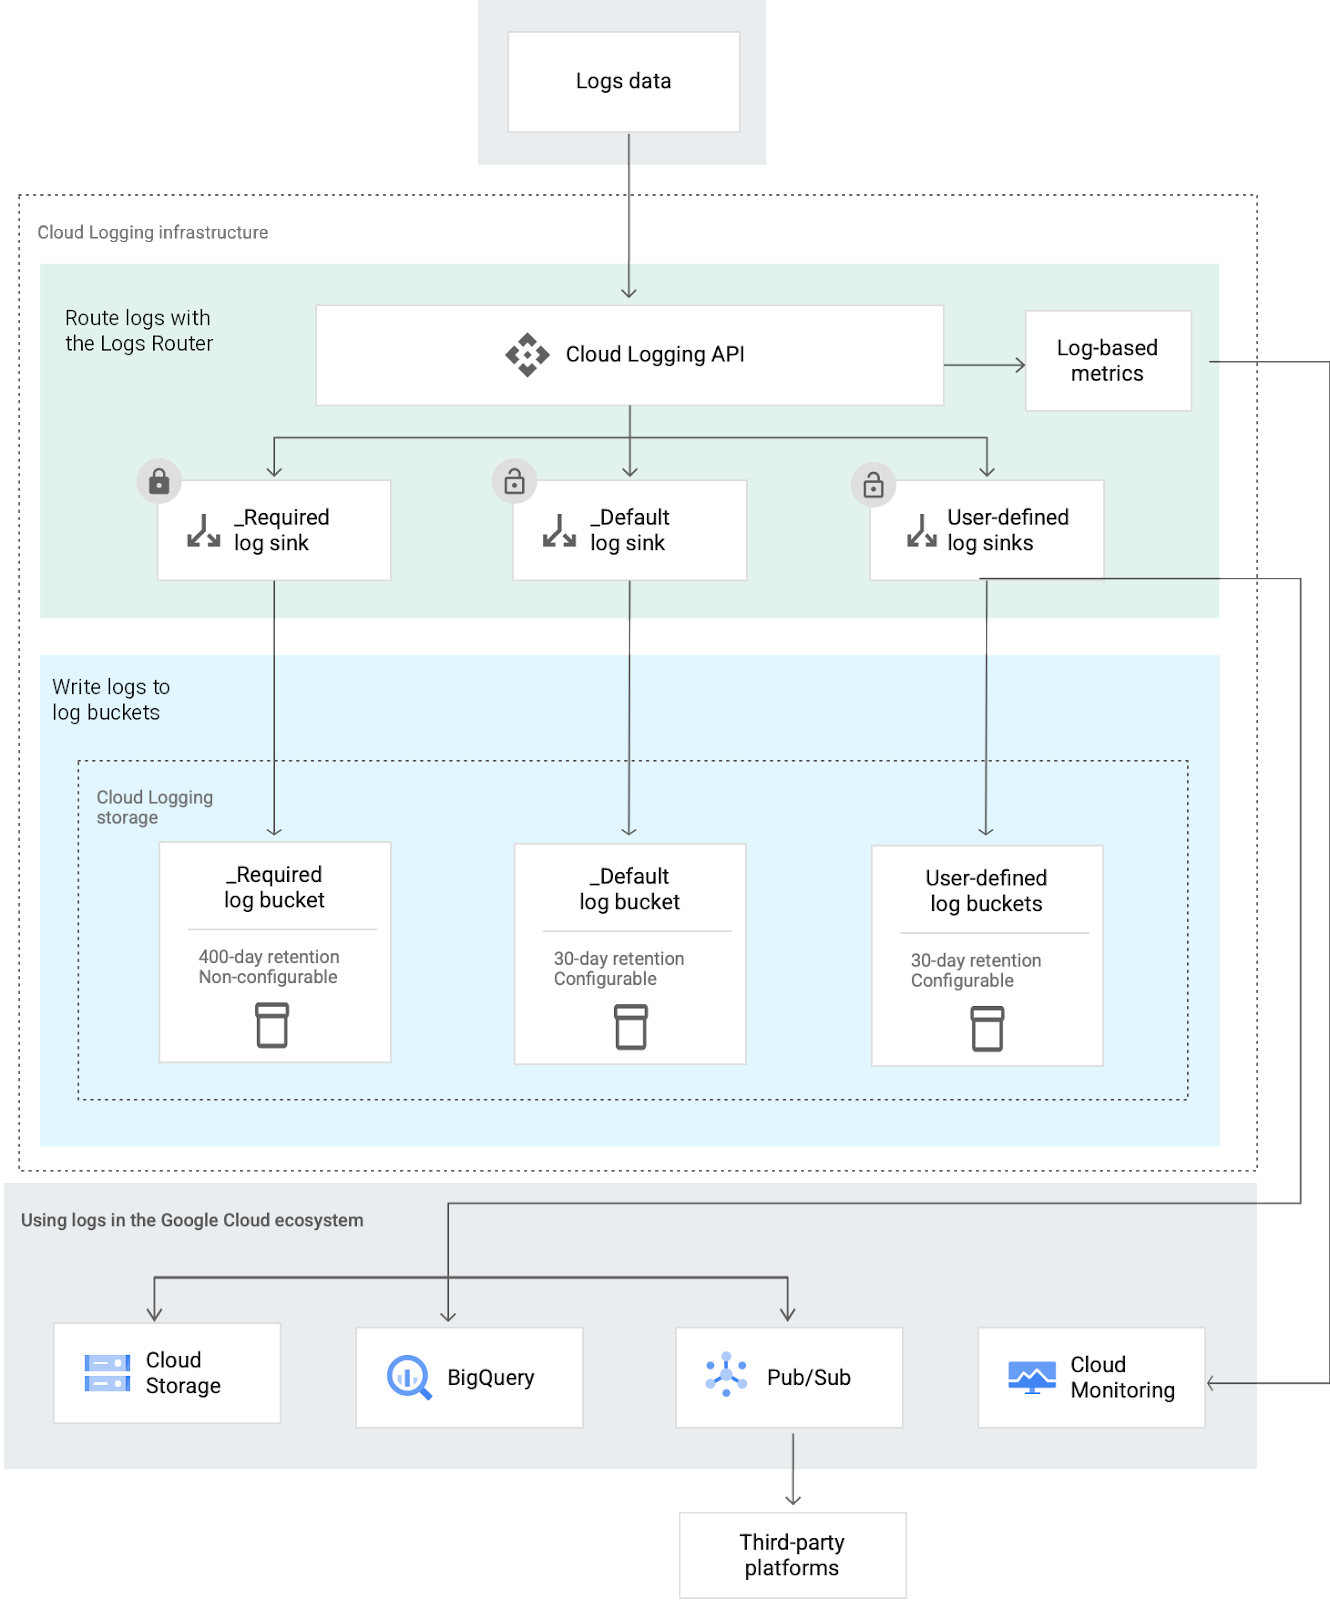
An overview of the logging ecosystem in GCP (source)
Log Storage in GCP
Logs can be stored in one of several cloud buckets within Cloud logging storage:
- the _Required log bucket,
- the _Default log bucket, and
- User defined log buckets.
The follow paragraphs provide more details of each of these buckets:
_Required Bucket
Holds the following types of logs:
- Admin Activity audit logs
- System Event audit logs
- Google Workspace Admin Audit logs
- Enterprise Groups Audit logs
- Login Audit logs
- Access Transparency logs (Must be enabled see guide)
Logs in this bucket are retained for 400 days, this can not be changed, additionally the bucket itself can not be modified or deleted nor can the _Required sink that routes logs to the _Required bucket.
_Default Bucket
Holds any other logs that are not stored in the _Required Bucket such as Data Access audit logs and Policy Denied audit logs. Logs stored here are retained for 30 days but this can be configured to a custom retention period, GCP has a guide on doing this, here. The _Default bucket can not be deleted but the _default sink that routes logs to the bucket can be disabled and modified.
User Defined Buckets
Holds any logs routed to it via sinks, you can route any subset of your logs to any user defined log bucket. This bucket retains logs for 30 days by default, but this can be configured to a custom retention period, GCP has a guide on doing this, here.
Viewing and Accessing Logs in GCP
The easiest way to view logs is using the Logs Explorer via the console, but it is also possible to access them via the Logging API and the Google Cloud CLI.
Using Log Explorer
To view Logs in Log Explorer you will first need to ensure that you have the correct permissions:
- To view all logs in the _Required bucket and the logs included in the _Default view from the _Default bucket, you will need the role: [roles/logging.viewer].
- To view all logs in both the _Required and _Default buckets, including Data Access logs, you will need the role: [roles/logging.privateLogViewer].
- To view logs in user-defined buckets, you will need this role: [roles/logging.viewAccessor].
Note for user defined buckets. The role must be applied to the project that the bucket is assigned to. This is dependent on the way your GCP environment is set up, either the log bucket is assigned to the project it is logging. In which case you would need the role to be assigned to the project. Alternatively you have all your log buckets gathered under one project exclusively for logs, in this case you would need the role to be applied to the “log buckets” project.
Once you have confirmed you have the correct permissions, the Logs Explorer can be found under the Logging section of the Google Cloud Console.
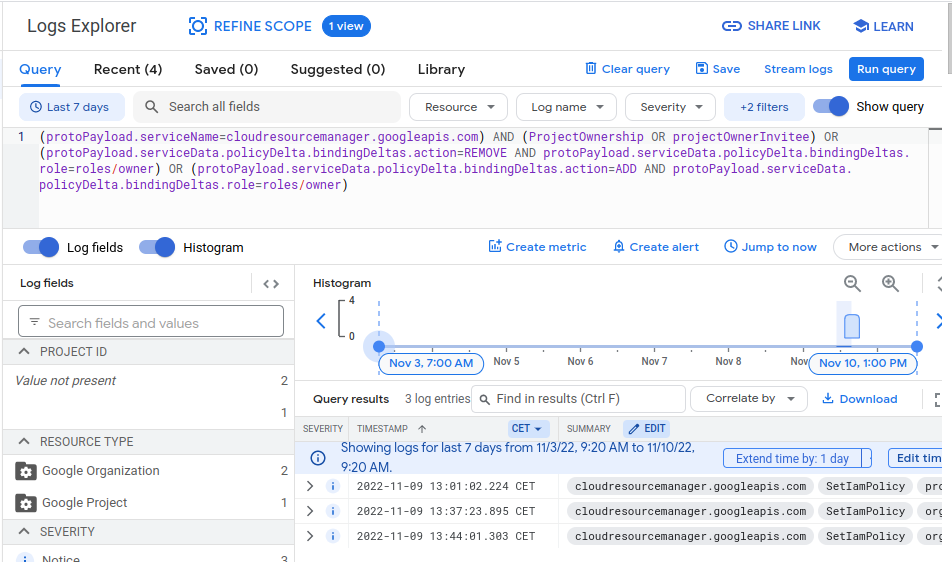
GCP Log Explorer (Source)
Using the GCP CLI
The serviceusage.services.use permission is needed to use any command from the gcloud logging library, as well the IAM role that corresponds to the logs location, and the correct IAM role for the use case:
| Use case | IAM role |
| List logs | Logging/Logs Viewer |
| Tail logs | Logging/Logs Viewer |
| Delete logs | Logging/Logging Admin |
| Write logs | Logging/Logs Writer |
| Read logs | Logging/Logs Viewer |
| Read Data Access audit logs | Logging/Private Logs Viewer |
| List sinks | Logging/Logs Viewer |
| Create sinks | Logging/Logs Configuration Writer |
| Update sinks | Logging/Logs Configuration Writer |
| Delete sinks | Logging/Logs Configuration Writer |
| List metrics | Logging/Logs Viewer |
| Create basic metrics | Logging/Logs Configuration Writer |
| Create advanced metrics | Logging/Logs Configuration Writer |
| Update metrics | Logging/Logs Configuration Writer |
| Delete metrics | Logging/Logs Configuration Writer |
To read logs from the CLI, you can use gcloud logging read [FILTER] where FILTER is a query expression for the logs you are requesting. Google provides guidance on its logging query language, here.
For example, this query returns ten log entries in your project’s syslog log from Compute Engine instances containing payloads that include the word SyncAddress shown in JSON format:
gcloud logging read "resource.type=gce_instance AND logName=projects/[PROJECT_ID]/logs/syslog AND textPayload:SyncAddress" --limit 10 --format jsonAnd here is one of the entries it returns:
{
"insertId": "2016-04-07|08:56:48.137651-07|10.162.32.129|-1509625619",
"logName": "projects/[PROJECT_ID]/logs/syslog",
"resource": {
"labels": {
"instance_id": "15543007601548829999",
"zone": "us-central1-a"
},
"type": "gce_instance"
},
"textPayload": "Apr 7 15:56:47 my-gce-instance google-address-manager: ERROR SyncAddresses exception: HTTP
Error 503: Service Unavailable",
"timestamp": "2016-04-07T15:56:47.000Z"
}
Cloud Audit Logs
All GCP services write audit logs, these record administrative activities and accesses within cloud resources. These logs help you determine the “who?, where?, and when?” of any activity within your environment. So it’s vital that they are configured properly before you need them during an incident.
GCP cloud audit logs are broken down into the following four categories:
Admin Activity audit logs contain log entries for API calls or other actions that modify the configuration or metadata of resources, such as when a user creates a VM instance or changes Identity and access management permissions. Admin Activity audit logs are always written, you can’t configure, exclude, or disable them. Even if you disable the Cloud Logging API, Admin Activity audit logs are still generated. For a list of services that write Admin Activity audit logs and what are logged, click here.
Data Access audit logs contain log entries for API calls that read the configuration or metadata of resources, as well as user API calls that create, modify, or read user resource data, publicly available resources that have the Identity and Access Management policies do not generate Data Access audit logs. Data Access audit logs (except for BigQuery Data Access audit logs) are disabled by default because audit logs can be quite large. For instructions on how to enable and configure Data Access audit logs, click here. For a list of services that write Data Access audit logs, and to see what activities generate those logs, click here.
System Event audit logs contain log entries for Google Cloud actions that modify the configuration of resources. System Event audit logs are generated by Google systems, they aren’t driven by direct user action. System Event audit logs are always written; you can’t configure, exclude, or disable them.
For a list of services that write System Event audit logs, and to see what activities generate those logs, click here.
Policy Denied audit logs are recorded when a Google Cloud service denies access to a user or service account because of a security policy violation. Policy Denied audit logs are generated by default,and you can’t disable Policy Denied audit logs. For a list of services that write Policy Denied audit logs, click here.
Configuring Audit Logs to Capture Activity
To ensure that the cloud audit logs track all service and user activity within your GCP environment you can follow the following steps to configure the audit logs.
- From the Google Cloud Management Console, select the deployment selector in the top navigation bar and select ALL, this will list all existing deployments, then choose the GCP organization you wish to configure.
- Next, go to the IAM and Admin console. This can be found at: https://console.cloud.google.com/iam-admin/iam
- Select Audit Logs from the main navigation panel.
- On the Audit logs page, click the SET DEFAULT CONFIGURATION option from the console top menu.
- Under the LOG TYPES tab, check the boxes next to the logs that you wish to enable i.e. Admin Read, Data Read, and Data Write. This will enable audit logging across all supported GCP services. Click save to apply the configuration.
- Under the EXEMPTED PRINCIPALS tab, delete all users from the Exempted principals list. This will ensure that you are tracking activity from all users and no users are exempt from audit logging. Click save to apply the configuration.
Logs across GCP Products
As it would be impractical to go over each of GCP’s over 100 products, we’ll cover the most popular GCP products and their logging options.
Google Kubernetes Engine (GKE)
GKE Collects the following audit logs:
Admin Activity audit logs record admin activity, including “admin write” activity where metadata of configuration information is written. Admin Activity logs can not be disabled. Here is a full list of actions that are audited:
- io.k8s.authorization.rbac.v1
- io.k8s.authorization.rbac.v1.roles
- google.container.v1.ProjectClusterService.ListUsableSubnetworks
- Any GKE API method that starts with Create, Update, Set, or Delete, such as google.container.v1.ClusterManager.CreateCluster.
Data Access audit logs record any access to the data within the GKE service, including “admin read” actions where metadata of configuration information is read, as well as “data read” and “data write” actions that read or write user-provided data. Data Access audit logs are not enabled by default, for steps on how to enable them, click here. Here is a list of actions that are recorded in the Data Access audit logs:
- google.cloud.containersecurity.v1beta.ContainerSecurity.SearchClusterFindingSummaries
- google.cloud.containersecurity.v1beta.ContainerSecurity.ListFindings
GKE also stores logs itself. These are not stored permanently, however. GKE container logs for example, are lost when the host pod is removed or when the disk they are stored on is out of space or when overwritten by newer logs. System logs are periodically removed to free up space for new logs, and cluster events are removed after one hour.
The GKE logging agent provides container and system logs. By default, GKE deploys a per-node logging agent that reads container logs, adds helpful metadata, and then stores them in Cloud Logging. The GKE logging agent checks for container logs in the following sources:
- Standard output and standard error logs from containerized processes
- kubelet and container runtime logs
- Logs for system components, such as VM startup scripts
Optionally, GKE can collect additional types of logs from certain Kubernetes control plane components and store them in Cloud Logging:
- API server logs include all logs generated by the Kubernetes API server (kube-apiserver).
- Scheduler logs include all logs generated by the Kubernetes Scheduler (kube-scheduler).
- Controller Manager logs include all logs generated by the Kubernetes Controller Manager (kube-controller-manager).
Google Compute Engine (GCE)
GCE collects the following audit logs:
- Admin Activity audit logs include “admin write” operations that write metadata or configuration information. Admin activity logs are enabled by default and can not be disabled.
Here is a full list of the actions that generate log entries:- Creating resources
- Updating/patching resources
- Setting/changing metadata
- Setting/changing tags
- Setting/changing labels
- Setting/changing permissions
- Setting/changing any properties of a resource (including custom verbs)
- Data Access audit logs include “admin read” operations that read metadata or configuration information. They also include “data read” and “data write” operations that read or write user-provided data. Data Access audit logs are not enabled by default and must be enabled. For steps on enabling them, click here. The following actions are logged by the Data Access Audit Logs:
- Getting information about a resource
- Listing resources
- Listing resources across scope (aggregated list requests)
- Get the contents of the serial port console
- System Event audit logs identify automated Google Cloud actions that modify the configuration of resources. System Event audit logs are enabled by default and can not be disabled. The Following events are recorded in the System Event audit log:
- host maintenance
- Instance preemption
- Automatic restart
- Instance reset
- Serial port connect/disconnect
Google Cloud Storage (GCS)
Cloud Storage generates the following types of logs;
- Admin Activity audit logs are generated for operations that modify access to Cloud Storage resources, and entries for operations that create, delete, or modify buckets, managed folders, or inventory report configurations. Admin Activity audit logs can not be disabled.
- Data Access audit logs track actions that are not tracked in Admin Activity audit logs. These logs are not enabled by default, to enable them Google provides a guide, here. There are several sub-types of Data Access audit logs:
- ADMIN_READ: Entries for operations that read access configurations, read bucket metadata, or list buckets within a project.
- ADMIN_WRITE: Entries for operations that create, delete, or modify access configurations, or bucket metadata.
- DATA_READ: Entries for operations that read or list Cloud Storage resources other than buckets.
- DATA_WRITE: Entries for operations that create, delete, or modify objects and XML API multipart uploads.
Below is a table that summarizes which Cloud Storage operations correspond to each: audit log type:
| Audit log type | Sub-type | Cloud Storage operations |
| Admin Activity | ADMIN_WRITE | Setting/changing IAM policies Changing object ACLs Creating buckets Deleting buckets Updating bucket metadata Creating managed folders Deleting managed folders Creating inventory report configurations Updating inventory report configurations Deleting inventory report configurations |
| Data Access | ADMIN_READ | Getting IAM policies Getting object ACLs Getting bucket metadata Listing buckets |
| Data Access | DATA_READ | Getting object data Getting object metadata Listing objects Getting managed folder metadata Listing managed foldersCopying objects Composing objects Listing ongoing XML API multipart uploads Listing XML API multipart upload parts Getting inventory report configurations Listing inventory report configurations Getting inventory reports Listing inventory reports |
| Data Access | DATA_WRITE | Creating objects Deleting objects Updating non-ACL object metadata2 Copying objects Composing objects Initiating XML API multipart uploads Creating parts in an XML API multipart upload Aborting XML API multipart uploads Completing XML API multipart uploads |
Google Virtual Private Cloud
Google VPC collects the following audit logs:
- Admin Activity audit logs include “admin write” operations that write metadata or configuration information. Admin activity logs are enabled by default and can not be disabled. Here is the full list of operations recorded in the VPC Admin Activity audit logs:
firewalls.delete
firewalls.insert
firewalls.patch
firewalls.update
forwardingRules.delete
forwardingRules.insert
forwardingRules.patch
forwardingRules.setTarget
networks.addPeering
networks.delete
networks.insert
networks.patch
networks.removePeering
networks.switchToCustomMode
networks.updatePeering
policyBasedRoutes.create
policyBasedRoutes.delete
routes.delete
routes.insert
subnetworks.delete
subnetworks.expandIpCidrRange
subnetworks.insert
subnetworks.patch
subnetworks.setIamPolicy
subnetworks.setPrivateIpGoogleAccess
subnetworks.testIamPermissions- Data Access audit logs Include “admin read” operations that read metadata or configuration information. They also include “data read” and “data write” operations that read or write user-provided data. Data Access audit logs are not enabled by default and must be enabled. For steps on enabling them, click here. Here is a list of all the VPC operations that generate Data Access entries:
firewalls.get
firewalls.list
forwardingRules.aggregatedList
forwardingRules.get
forwardingRules.list
networks.get
networks.list
networks.listPeeringRoutes
policyBasedRoutes.get
policyBasedRoutes.list
routes.get
routes.list
subnetworks.aggregatedList
subnetworks.get
subnetworks.getIamPolicy
subnetworks.list
subnetworks.listUsable
Google Virtual Private Cloud also generates VPC Flow Logs that record a sample of network flows sent from and received by VM instances, including instances used as Google Kubernetes Engine nodes. These are recorded like most GCP logs in Cloud Logging. VPC flow logs are retained for 30 days by default, but this can be extended or the logs can be exported. VPC Flow Logs must be enabled manually. This can be done by following the steps below:
- In the Google Cloud console, go to the VPC networks page.
- Click the subnet that you want to update.
- Click Edit.
- For Flow logs, select On.
- If you want to adjust log sampling and aggregation, click Configure logs and adjust any of the following:
- 1) The Aggregation interval.
- 2) Whether to include metadata in the final log entries. By default, Include metadata includes all fields.
- 3) The Sample rate. 100% means that all entries are kept.
- Click Save.
Being IR Prepared with Cado
We understand that it can be difficult for security teams to know where to start when it comes to assessing their preparedness. Cado’s Incident Readiness Dashboard empowers organisations to continuously assess their ability to investigate and respond to cloud-based incidents.
The Cado Platform’s Incident Readiness Dashboard provides security teams with the ability to:
- Proactively run readiness checks, see readiness trends over time, and identify issues that could prevent the organization from rapidly responding to active threats.
- Ensure that your organization has the correct logging, management agents, and other cloud-native tools appropriately configured and operational.
- Ensure that data gathered during an investigation can be decrypted.
- Verify that your permissions are aligned with best practices and are capable of supporting your incident response efforts.
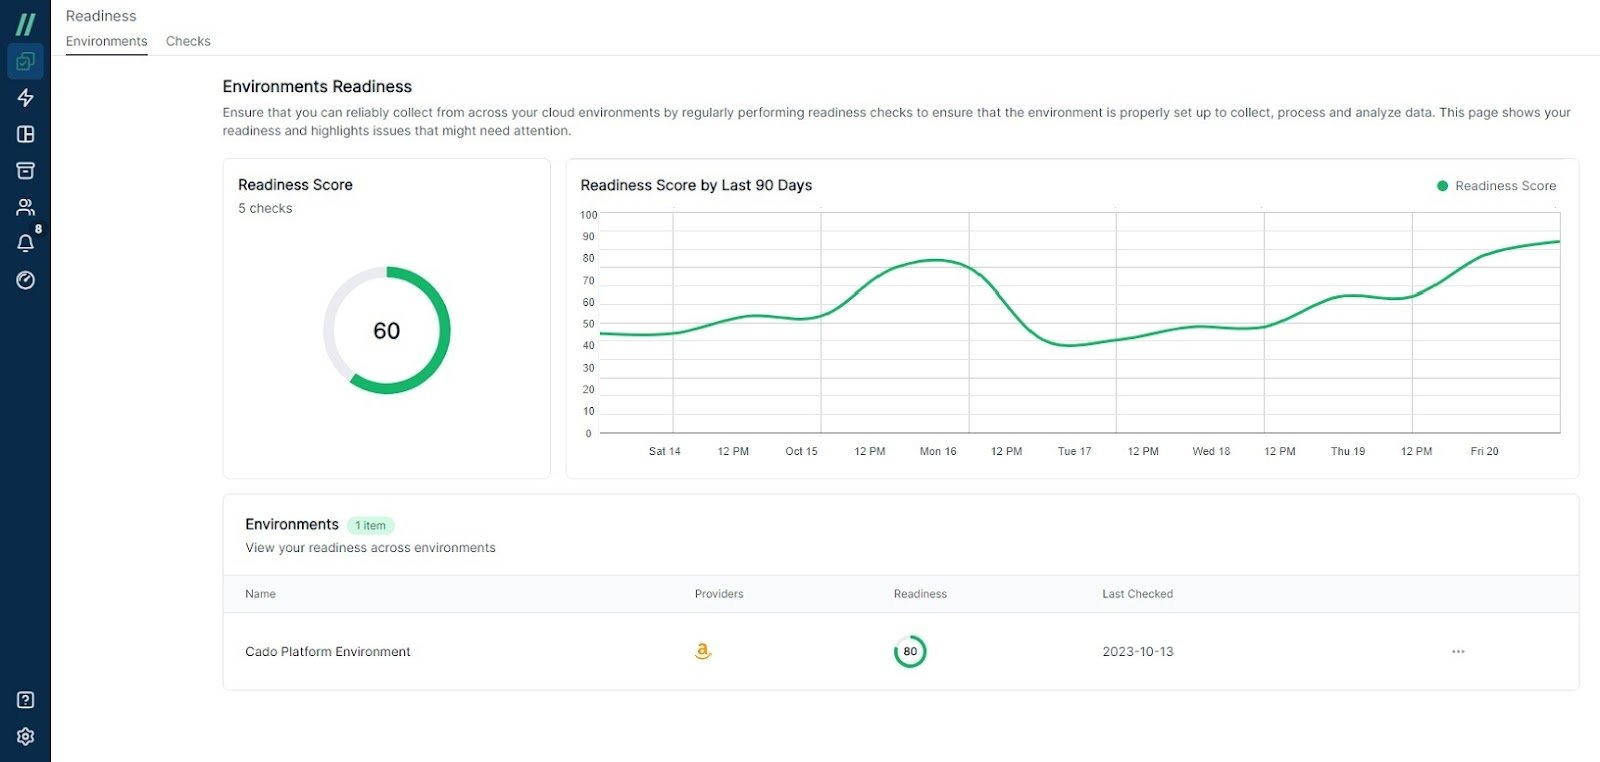
Cado’s Incident Readiness Dashboard
To see how Cado can help your organization audit its level of preparedness to investigate and respond to future incidents, contact our team to schedule a demo.