


At first glance, your XDR seems like an ideal tool to investigate an incident. But an XDR alone can leave you with some serious headaches in the aftermath of an incident. Every single Cado customer has an XDR - yet they choose Cado in addition to speed up their investigations. As we’ve said before, an XDR only works when it is installed and running - however in addition, an XDR:
- Doesn’t record everything that happens. The XDR is preconfigured to look for events that have the potential to be malicious, and bring it back to a central location. And it stands to reason - if every event that happened on an endpoint got pulled back into a central location you’d quickly overwhelm their remote network connections. However during an investigation you’re not just looking at overtly suspicious activities - for example, understanding which data the suspected attacker has accessed - and an XDR will leave gaps.
- Often doesn’t have good application visibility. The XDR spends a lot of time looking at kernel level operations, like commands, processes being executed, network connections being opened. However when it comes to looking at what actually happened, and translating it to understandable activity by looking at application logs and histories, it doesn’t always tell the full story. Even knowing the full URL where a user downloaded an infected file is not likely to be easily accessible.
- Can’t easily analyze all the data you need to understand an incident. During an incident, using an XDR to pull back all the data you need to understand what went on can be highly manual and time consuming - using lots of complex scripting and queries. And then once you do collect the data you’ll need a separate tool to process the data to understand what went on.
- Usually doesn’t have great cloud visibility. Even if you do have a cloud XDR, it’s usually just analyzing cloud provider logs, which can’t see what’s happening inside workloads. Moreover, most people don’t have XDR agents running inside workloads, but even if you do, all the above limitations still apply.
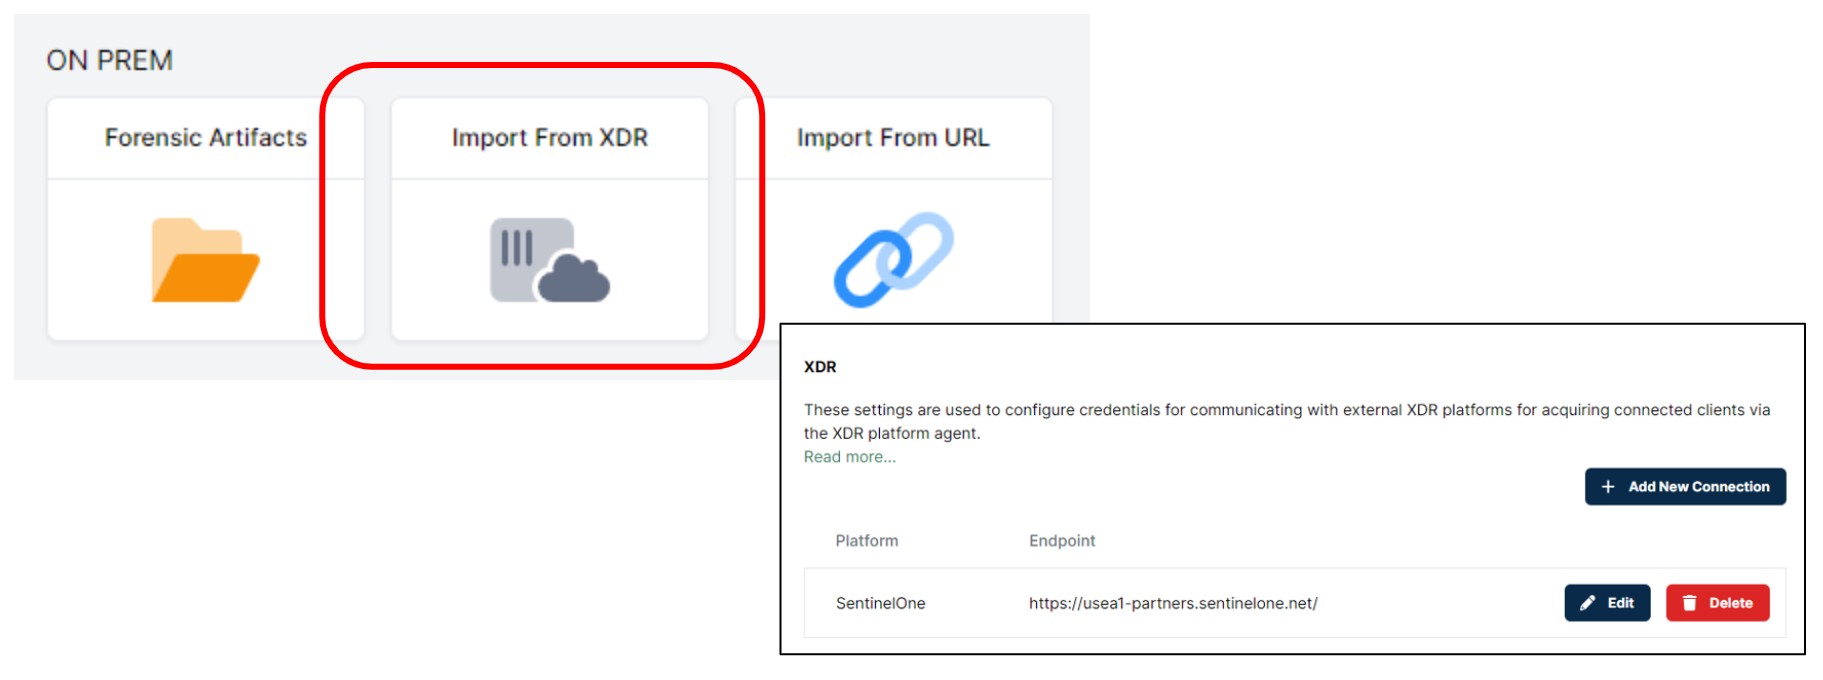
When you integrate Cado with your XDR platform you can use the connectivity of your XDR to automate the process of collecting and analyzing a “triage package”. This package contains of all the data you’re likely to need to understand the root cause and scope of an incident, including:
- All system logs, including application and authentication logs
- Master File Table to understand what files were where on the system
- Configuration files and registry to show how the system was set up
- Web Histories to understand what web URLS users were accessing
We already have an out of the box integration with SentinelOne - which means that you can get up and running in a matter of minutes - but our customers have set up integrations with a variety of XDR tools.
Even if your XDR agent isn’t even running on the target system at the time of the incident, you can still deploy Cado Host to automate the process of collecting, uploading, and analyzing the data you need. If you use existing forensics tools then we can pull data from those tools too to provide a unified investigation platform. What’s more, if the system is running in the cloud, you can set up Cado to collect this data and more - up to and including full disk, memory and cloud logs - automatically when a suspected incident occurs.
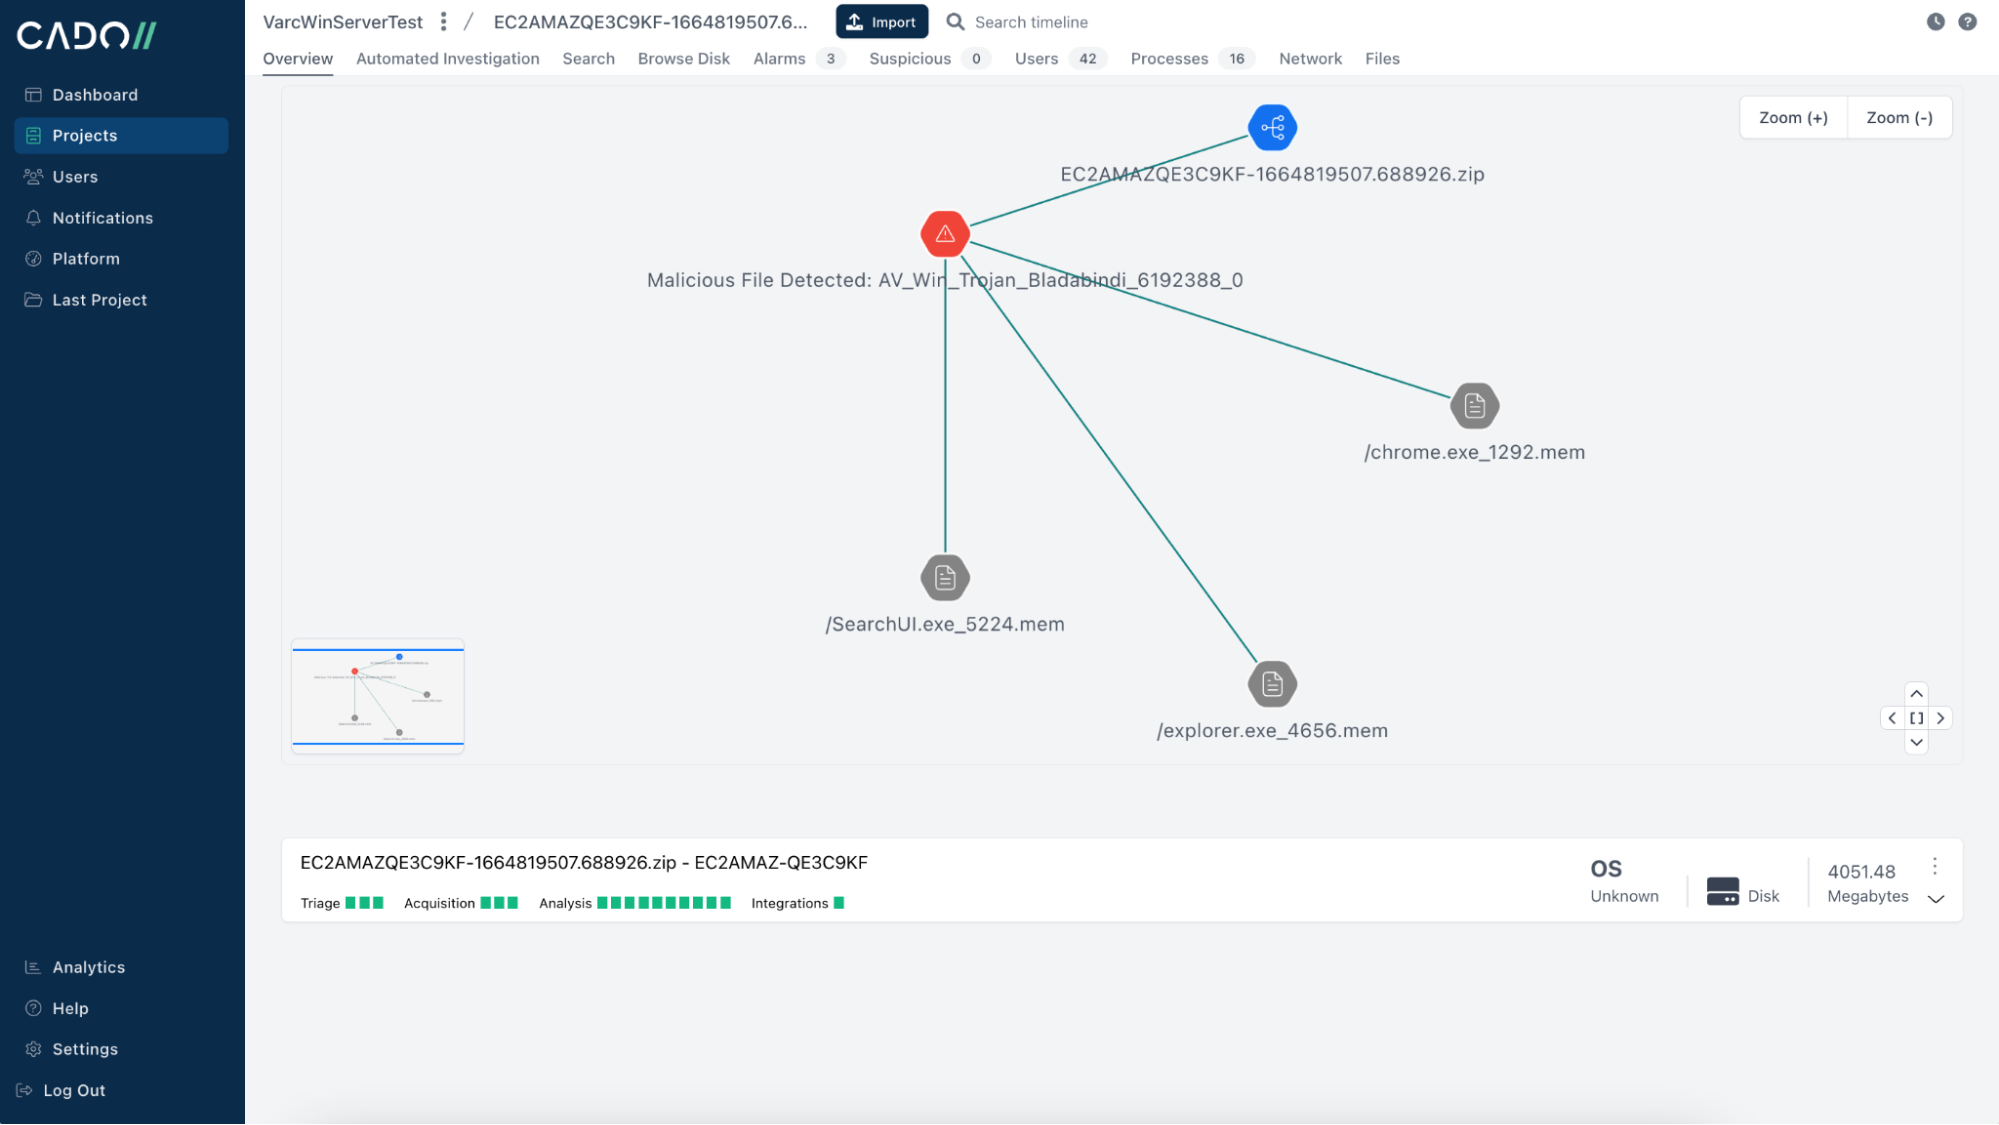
Once you have all the data, Cado processes and analyzes this data to create a super-timeline of all malicious, important, and relevant activities, and lets you tell the story of exactly what happened.
Having all this data at your fingertips will vastly shrink the time needed to respond effectively to an incident. To learn more, contact our team. If you're already eager to perform your own investigation, take advantage of our 14-day Free Trial.
Tag(s):
Cloud Investigations
More from the blog
View All PostsThe Importance of Depth: Cloud Forensics Beyond Log Analysis
January 4, 2024Continue Reading
New Features in Cloudgrep: Yara Rules, JSON Output and Log Parsing
December 5, 2023Continue Reading
Scaling Log Forensics in the Cloud with cloudgrep
November 10, 2023Continue Reading


Subscribe to Our Blog
To stay up to date on the latest from Cado Security, subscribe to our blog today.